Norwich House Prices
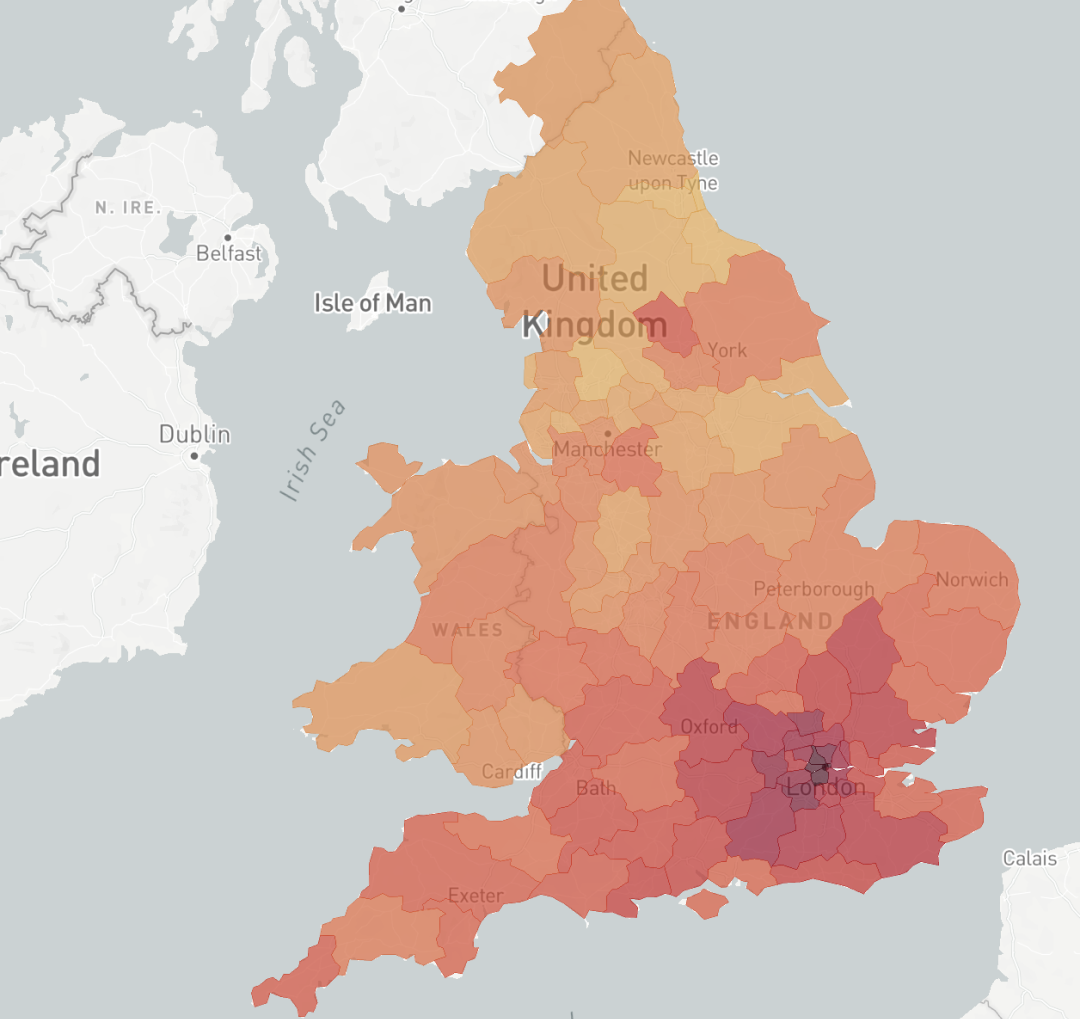
We've broken down the latest house price data for Norwich, you can view the data in both chart or table form. All data is taken from HM Land Registry's most recent public release. The average house in Norwich was sold for £292,962.0 in the last 12 months. This is a -2% (£-6,598) change compared to the previous 12 months. There has been a total of 10,032 properties sold in Norwich in the last year. The average price per square foot (£/sqft) was £282.13 this is compared to the UK average of £333.09.
June 2025 - May 2026
Norwich
June 2025 - May 2026
England & Wales Average
Norwich House Price Charts
You can select to view data based on the previous 1, 2 or 5 years. Please note: A drop in volume in the latest 3 months does not indicate a market change, it can take up to 3 months for HM Land Registry to process transaction data.
Average House Prices In Norwich
Transaction Volume By Property Type In Norwich
Historcal £/sqft In Norwich
£/sqft by the number of rooms in the property In Norwich
Average property price by floor size In Norwich
| Property Size | Area Average | UK Average |
|---|---|---|
| 6+ | £2,930.71 | £3,735.43 |
| 5 | £3,045.1 | £3,355.55 |
| 4 | £3,076.13 | £3,372.37 |
| 3 | £3,116.81 | £3,767.58 |
| 2 | £2,921.16 | £4,200.99 |
| 1 | £2,730.62 | £5,293.83 |
Sales volumes by floor size In Norwich
| Property Size | Sales Volume |
|---|---|
| 150m²+ | 945 |
| 110-149m² | 1,543 |
| 90-109m² | 1,647 |
| 70-89m² | 2,861 |
| 50-69m² | 2,157 |
| 30-49m² | 477 |
| under 30m² | 14 |
Volume by Property Type In Norwich
| Property Size | Sales Volume |
|---|---|
| Terraced | 231,540.64 |
| Semi-Detached | 270,602.38 |
| Flat | 155,745.21 |
| Detached | 404,312.43 |
Average price by Type In Norwich
| Property Size | Avg Price |
|---|---|
| Detached | £ 404,312.43 |
| Flat | £ 155,745.21 |
| Semi-Detached | £ 270,602.38 |
| Terraced | £ 231,540.64 |
Volume by Build Type In Norwich
| Property Size | Sales Volume |
|---|---|
| An established property | 9,763 |
| A newly built property | 269 |
Average price by Build Type In Norwich
| Property Size | Avg Price |
|---|---|
| An established property | £ 297,012.6 |
| A newly built property | £ 356,217.79 |
Average House Prices In Norwich
Transaction Volume By Property Type In Norwich
Historcal £/sqft In Norwich
£/sqft by the number of rooms in the property In Norwich
Average property price by floor size In Norwich
| Property Size | Area Average | UK Average |
|---|---|---|
| 6+ | £2,915.32 | £3,760.79 |
| 5 | £2,990.78 | £3,331.46 |
| 4 | £3,059.88 | £3,375.35 |
| 3 | £3,141.99 | £3,820.5 |
| 2 | £2,936.41 | £4,312.7 |
| 1 | £2,831.62 | £5,588.52 |
Sales volumes by floor size In Norwich
| Property Size | Sales Volume |
|---|---|
| 150m²+ | 2,247 |
| 110-149m² | 3,690 |
| 90-109m² | 3,954 |
| 70-89m² | 6,933 |
| 50-69m² | 4,951 |
| 30-49m² | 1,034 |
| under 30m² | 34 |
Volume by Property Type In Norwich
| Property Size | Sales Volume |
|---|---|
| Terraced | 227,864.65 |
| Semi-Detached | 270,668.12 |
| Flat | 164,837.87 |
| Detached | 404,807.67 |
Average price by Type In Norwich
| Property Size | Avg Price |
|---|---|
| Detached | £ 404,807.67 |
| Flat | £ 164,837.87 |
| Semi-Detached | £ 270,668.12 |
| Terraced | £ 227,864.65 |
Volume by Build Type In Norwich
| Property Size | Sales Volume |
|---|---|
| An established property | 22,225 |
| A newly built property | 1,586 |
Average price by Build Type In Norwich
| Property Size | Avg Price |
|---|---|
| An established property | £ 296,329.05 |
| A newly built property | £ 353,069.25 |
Average House Prices In Norwich
Transaction Volume By Property Type In Norwich
Historcal £/sqft In Norwich
£/sqft by the number of rooms in the property In Norwich
Average property price by floor size In Norwich
| Property Size | Area Average | UK Average |
|---|---|---|
| 6+ | £2,951.16 | £3,752.15 |
| 5 | £2,974.78 | £3,256.89 |
| 4 | £3,076.1 | £3,303.08 |
| 3 | £3,144.77 | £3,742.68 |
| 2 | £2,981.84 | £4,250.9 |
| 1 | £2,786.88 | £5,667.29 |
Sales volumes by floor size In Norwich
| Property Size | Sales Volume |
|---|---|
| 150m²+ | 6,157 |
| 110-149m² | 10,293 |
| 90-109m² | 10,593 |
| 70-89m² | 18,775 |
| 50-69m² | 13,646 |
| 30-49m² | 2,972 |
| under 30m² | 94 |
Volume by Property Type In Norwich
| Property Size | Sales Volume |
|---|---|
| Terraced | 226,533.14 |
| Semi-Detached | 271,249.92 |
| Flat | 169,086.4 |
| Detached | 410,609.32 |
Average price by Type In Norwich
| Property Size | Avg Price |
|---|---|
| Detached | £ 410,609.32 |
| Flat | £ 169,086.4 |
| Semi-Detached | £ 271,249.92 |
| Terraced | £ 226,533.14 |
Volume by Build Type In Norwich
| Property Size | Sales Volume |
|---|---|
| An established property | 58,701 |
| A newly built property | 6,626 |
Average price by Build Type In Norwich
| Property Size | Avg Price |
|---|---|
| An established property | £ 297,273.66 |
| A newly built property | £ 338,354.59 |
Recent Transactions In Norwich
View 25 most recent property transactions in Norwich